Global Securities Firms Regulatory Inquiry App
GameStop Stock Chart Illustrates Trading Lesson - GameStop (NYSE:GME)
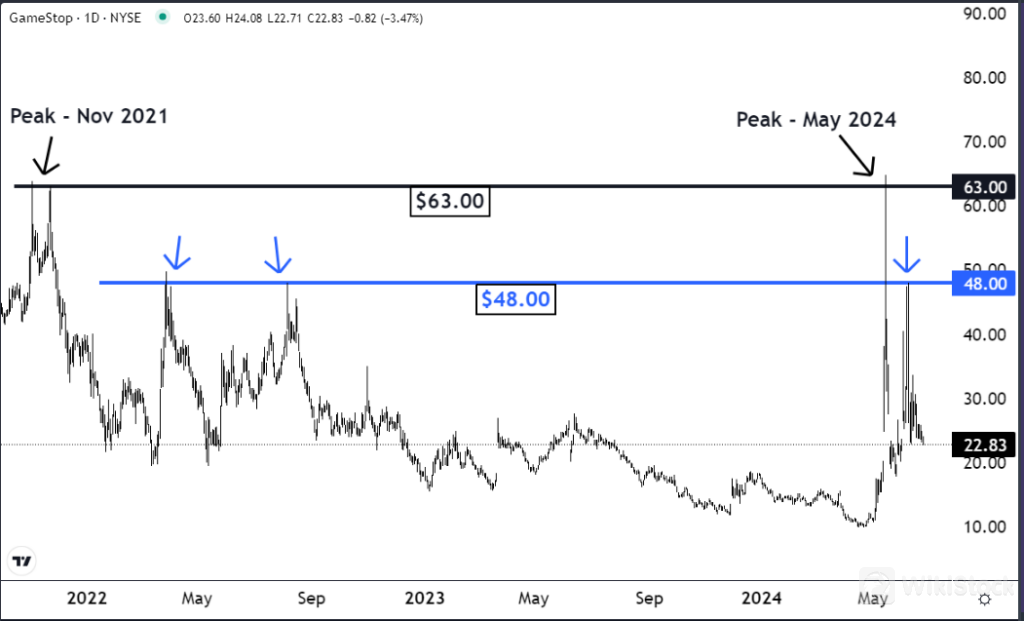
The same type of price action also took place around the important $48 level.
The level was first resistance in March 2022. Then it was resistance again in August 2022.
On June 6 of this year, the stock took off again because of Roaring Kitty and the Reddit community. It ran into resistance around $43 and reversed again.
The Last Word: The term “market memory” refers to the fact that an important price level can retain its importance for a long time, for months or even years.
Sometimes traders have profitable positions but they have a difficult time determining a sell target. It would be logical to consider having it at a price that had previously been a peak or top.
GME Price Action: GameStop shares were trading 1.3% lower Tuesday at $23.34.
Photo via Shutterstock.
© 2024 Benzinga.com. Benzinga does not provide investment advice. All rights reserved.
Key areas for mutual funds to make money in 2025
Yushu Technology's robot dog explodes the market!
Byte refutes rumors of speculation on A-share Doubao concept stocks
How to develop a low-altitude economy
Check whenever you want
WikiStock APP