Global Securities Firms Regulatory Inquiry App
Classic Bearish Technical Analysis Patterns On The Chart Of Micron - Micron Technology (NASDAQ:MU)
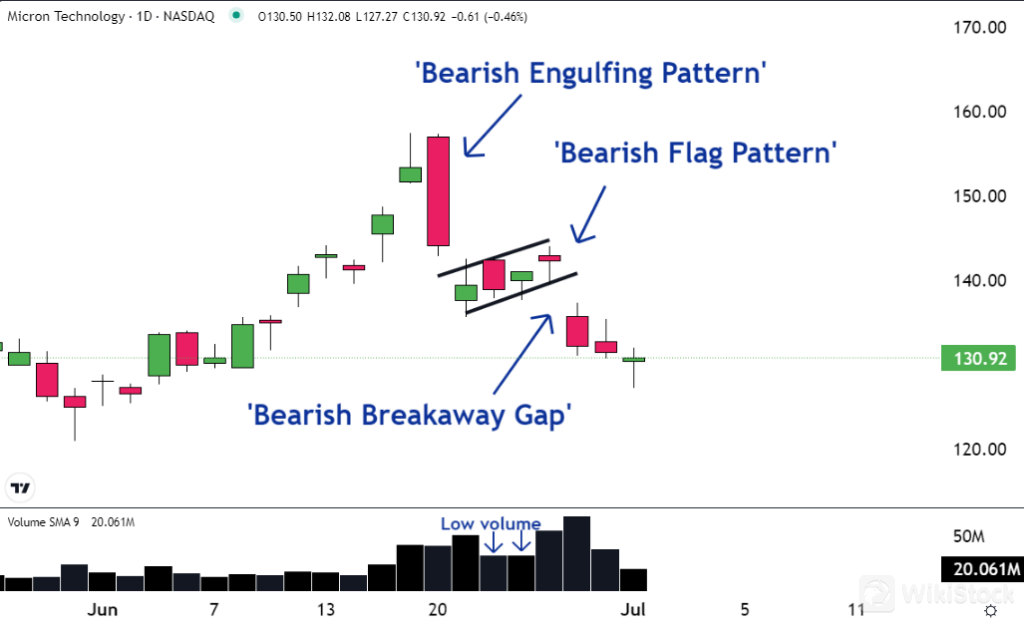
And then another pattern showed up ... It was aBearish Flag.
This pattern illustrates how the people who are responsible for the move lower decided to take a break. They think if they stop selling for a few days, the price could be higher and they could finish their orders at a better price.
As a result, there is a break of the trend with low volume as they sit on the sidelines. It shows up on the chart as a ‘flag’ as the shares drift higher.
The third pattern is a bearishBreakaway Gap. It forms on a chart when sellers are so aggressive and so ready to get out of their positions that don't care about the price.
They just want out.
As a result, the opening price is significantly lower than the prior days close. This action manifests itself as a gap or levels where the shares didn't trade on the chart.
It's unfortunate that technical analysis has a bad rap because it shouldn't. If applied and understood correctly, technical analysis is an illustration of supply and demand.
Savvy traders can use this analysis to profit.
The three illustrations of bearish patterns on the Micron chart would suggest this new downtrend forming may be just getting started. There's a good chance the shares move lower.
Check whenever you want
WikiStock APP