First American Q2 Earnings Top, Revenues Miss Estimates - First American Financial (NYSE:FAF), Progressiv

First American Financial FAF reports a second-quarter 2024 operating income per share of $1.27, which beat the Zacks Consensus Estimate by 12.4%. The bottom line decreased 5.9% year over year.
The insurer's results reflect the benefits of the seasonal pick-up in demand despite challenging market conditions.
Behind the Headlines
Operating revenues of $1.6 billion dropped 2.1% year over year due to lower agent premiums and information and other. The top line missed the Zacks Consensus Estimate by 1.2%.
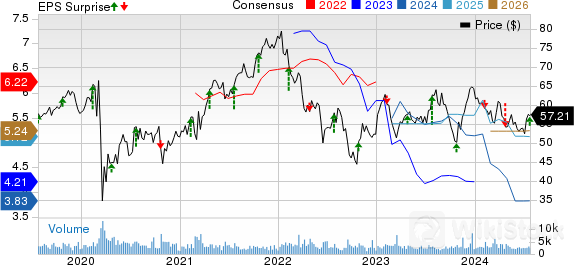
First American Financial Corporation Price, Consensus and EPS Surprise

First American Financial Corporation price-consensus-eps-surprise-chart | First American Financial Corporation Quote
Investment income was $129.9 million in the first quarter, declining 4.5% year over year. The figure was lower than our estimate of $150 million.
Expenses inched down 0.9% to $1.5 billion. Our estimate was $1.5 billion.
Segment Results
Title Insurance and Services: Total revenues fell 0.6% year over year to $1.5 billion. The downside was due to lower agent premiums and information and other. The figure was in line with our estimate.
Investment income of $126 million declined 11.3% year over year. The downside was primarily due to lower average interest-bearing escrow and tax-deferred property exchange balances, partly offset by higher interest income from the company's warehouse lending business.
Adjusted pretax margin contracted 70 basis points (bps) year over year to 11.9%. Title open orders dropped 2.8% to 169,600. Title closed orders fell 2.8% to 124,700. The average revenue per direct title order increased 0.9% to $11,700, primarily owing to a shift in the mix from lower premium default transactions to higher premium commercial transactions and an increase in the average revenue per order for purchase transactions.
Home Warranty: Total revenues increased 0.3% to $106 million. The figure was higher than our estimate of $102.6 million. Pretax income of $16.5 million increased 15.4% year over year. The claim loss rate was 45.8% in the first quarter, contracting 340 bps due to lower claim severity, which was partially offset by higher claim frequency. The pretax margin was 15.4%, which expanded 200 bps year over year.
Corporate: Net investment income was $4 million, down 50% year over year, primarily attributable to changes in the value of investments associated with the company's deferred compensation program. This amount was offset by lower personnel expenses reflecting returns on the plan participants' investments.
Interest expenses were $23 million, up 9% year over year due to higher interest expenses in the company's warehouse lending business.
Financial Update
First American exited the quarter with cash and cash equivalents of $2 billion, down 43.2% from the end of 2023. Notes and contracts payable were $1.4 billion, up 0.4% from the end of 2023.
Stockholders' equity was $4.7 billion, down 0.7% from the 2023-end level. The debt-to-capital ratio was 29.7.
FAF bought back shares worth $4 1million in the quarter. Through Jul 23, it repurchased an additional $15 million worth of shares.
Cash flow from operations was $267 million, down 0.7% year over year.
Zacks Rank
FAF currently carries a Zacks Rank #3 (Hold).
Performance of Other Insurers
The Travelers Companies TRV reported a second-quarter 2024 core income of $2.51 per share, which beat the Zacks Consensus Estimate by 25.5%. The bottom line skyrocketed from 6 cents in the year-ago quarter, driven by solid underlying results, net favorable prior-year reserve development and higher net investment income, partially offset by higher catastrophe losses. Travelers' total revenues increased 12.4% from the year-ago quarter's figure to $11.3 billion, primarily driven by higher premiums. The top-line figure missed the Zacks Consensus Estimate by 1%.
Net written premiums increased 8% year over year to a record $11.1 billion, driven by strong growth across all three segments. The figure was higher than our estimate of $10.4 billion. Travelers witnessed an underwriting loss of $65 million, narrower than a loss of $640 million incurred in the year-ago quarter. The combined ratio improved 630 bps year over year to 100.2 due to an improvement in the underlying combined ratio, higher net favorable prior-year reserve development and lower catastrophe losses, as a percentage of net earned premiums. The Zacks Consensus Estimate was pegged at 97.
The Progressive Corporation's PGR second-quarter 2024 earnings per share of $2.65 beat the Zacks Consensus Estimate of $1.99. The bottom line improved more than five times year over year. Operating revenues of $18.3 billion beat the Zacks Consensus Estimate by 1.4% and increased 18.9% year over year.
Net premiums earned grew 19% to $17.2 billion and beat our estimate of $16.7 billion. The combined ratio improved by 850 bps from the prior-year quarter's level to 91.9.
Selective Insurance Group, Inc. SIGI reported a second-quarter 2024 operating loss of $1.10 per share against the Zacks Consensus Estimate for earnings of $1.56. The company reported an operating income of 99 cents per share in the prior-year quarter. The quarterly results reflected poor underwriting performance, unfavorable prior-year casualty reserve development and escalating costs, offset by higher premiums and net investment income.
Total revenues of $1.2 billion increased 15% from the year-ago quarter's figure, primarily due to higher premiums earned, net investment income and net premiums written. The top line missed the Zacks Consensus Estimate by 1.3%.
© 2024 Benzinga.com. Benzinga does not provide investment advice. All rights reserved.
How do you position yourself in the silver economy?
Cross-border ETF turnover rate reaches 500%, and major funds flow into semiconductors
Why is the oil rally heating up in the new year?
Precious metals rise, how to allocate in the medium and long term
Check whenever you want
WikiStock APP
