Global Securities Firms Regulatory Inquiry App
General Motors Stock Chart Reveals Seller's Remorse - General Motors (NYSE:GM)
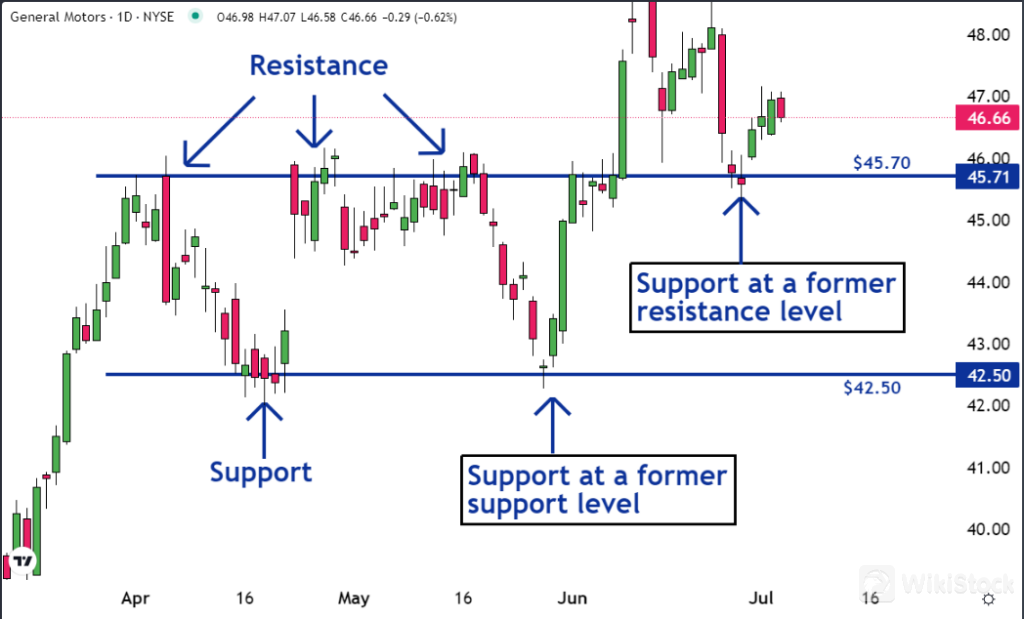
Then in late May another selloff occurred and once again the shares found support at $42.50. This wasn't a surprise because previous support levels often provide a safety net due to seller's remorse.
In April, some investors sold their shares at the support level, only to see the price increase shortly afterward. These sellers, experiencing regret, often vow to repurchase their shares, but only at the price they initially sold them for.
As a result, they place buy orders at the price that had previously been support. If there is a sufficient quantity of these orders it will form support at the level once again.
Seller's remorse can also turn a resistance level into a support level. This can also be seen in the chart above.
The $45.70 level was resistance throughout April and May. When the stock moved higher in June, a number of the people who sold while the shares were at resistance came to believe they made a mistake.
Many remorseful sellers decided to buy back their shares if they were able to get them at the same price they sold them for. As a result, when the shares fell back to what was previously the support level, these sellers placed buy orders, reinforcing the support at that price level.
In cases where there are enough of these buy orders, a level that had been resistance can convert into support. As you can see on the chart, this is what happened here.
To understand technical analysis, charts need to be viewed through the prism of investor and trader psychology. Most traders overthink and end up losing money.
The best traders know which levels and trends are important. And they know how to profit from them.
The General Motors chart is an excellent illustration of the importance of particular price levels.
Photo: Shutterstock
© 2024 Benzinga.com. Benzinga does not provide investment advice. All rights reserved.
Byte refutes rumors of speculation on A-share Doubao concept stocks
How to develop a low-altitude economy
Doubao concept surges, IPO economy booms
5G enters the "second half", which stocks are the best to buy
Check whenever you want
WikiStock APP